POS BACK OFFICE HOMEPAGE
This part on Home of Back Office Features
Sales Selected Date Filter
This feature allows users to filter sales data based on a specific date range. It enables users to view sales information for a particular period, such as a week, month, or custom date range.
Sales Performance Indicator
Visual indicators are shown to reflect sales performance compared to last month:
- A red colored arrow down (↓) with a percentage means sales are lower than last month.
- A green colored arrow up (↑) with a percentage means sales are higher than last month.
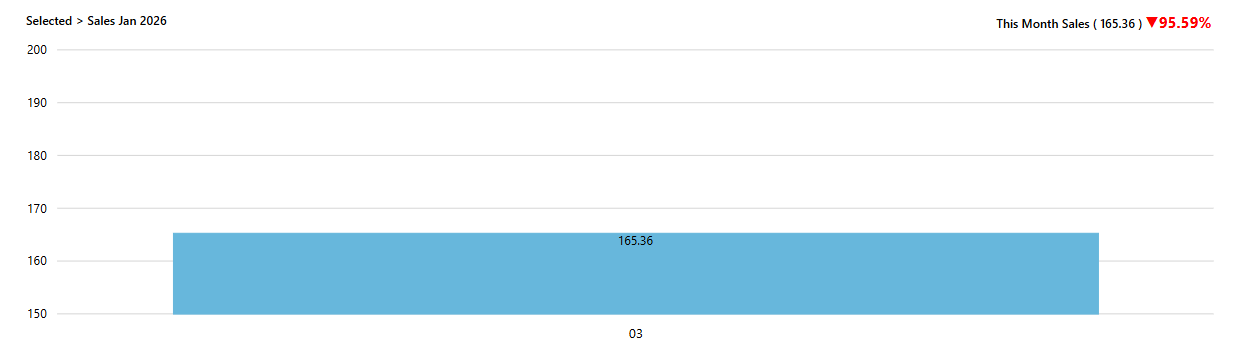 |
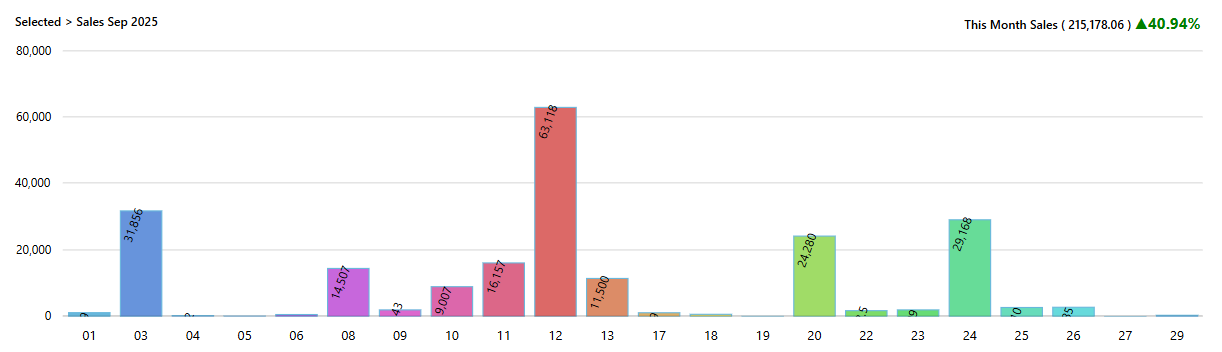
This Month Sales:
This section displays the total sales generated within the current month. It provides an overview of the revenue earned during the present month.
Sales Indicator:
- Red arrow down (↓) with percentage – Sales decreased compared to last month
- Green arrow up (↑) with percentage – Sales increased compared to last month
| |
 |
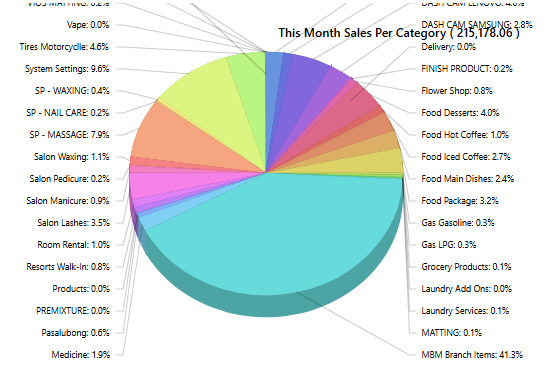
This Month's Sales per Category:
This part breaks down the sales data into different categories, showing the revenue generated by each category within the current month. It helps identify which product categories are driving sales.
 |
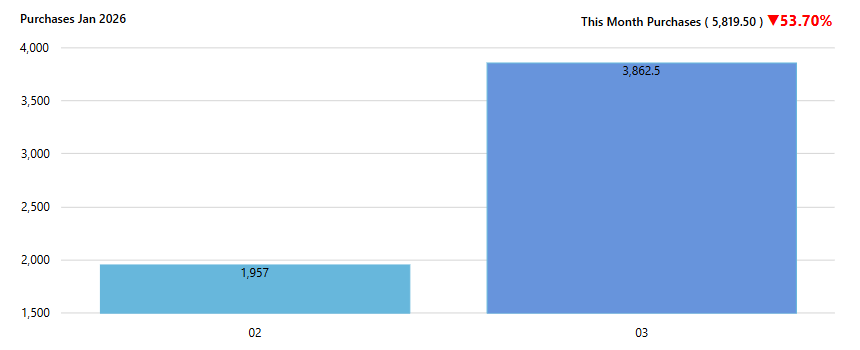
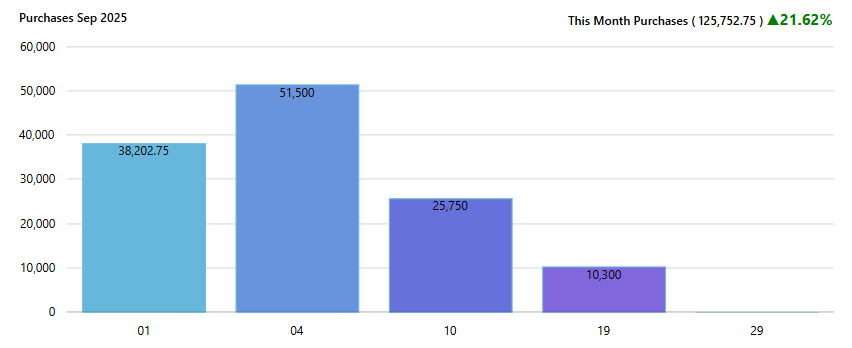
This Month Purchases:
This section shows the total amount spent on purchases within the current month. It allows users to track expenses related to inventory or supplies.
Purchase Trend Indicator:
- Red arrow down (↓) – Purchases decreased compared to last month
- Green arrow up (↑) – Purchases increased compared to last month
 |
 |
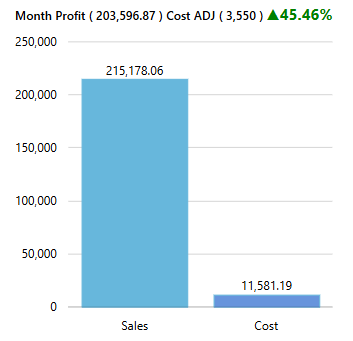
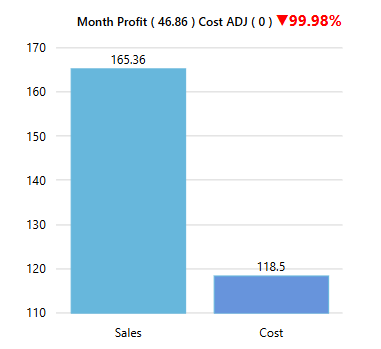
Month Profit:
This component calculates the overall profit for the current month by subtracting total purchases from total sales. It provides insights into the financial performance of the business.
Profit Indicator:
- Red arrow down (↓) – Profit is lower than last month
- Green arrow up (↑) – Profit is higher than last month
 |
 |
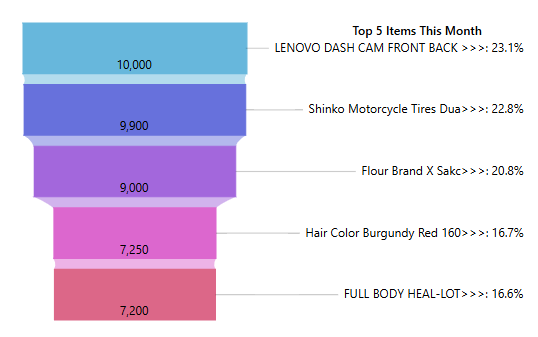
Top 5 Items:
This section identifies the top five best-selling items based on sales volume or revenue generated. It helps users understand which products contribute most to overall sales.
Item Performance Indicator:
- Red arrow down (↓) – Item sales decreased compared to last month
- Green arrow up (↑) – Item sales increased compared to last month
 |